
How to inspect an element without opening DevTools
DevTools is powerful and crowded. Most of the time you only want the numbers for one element, right where you are looking.
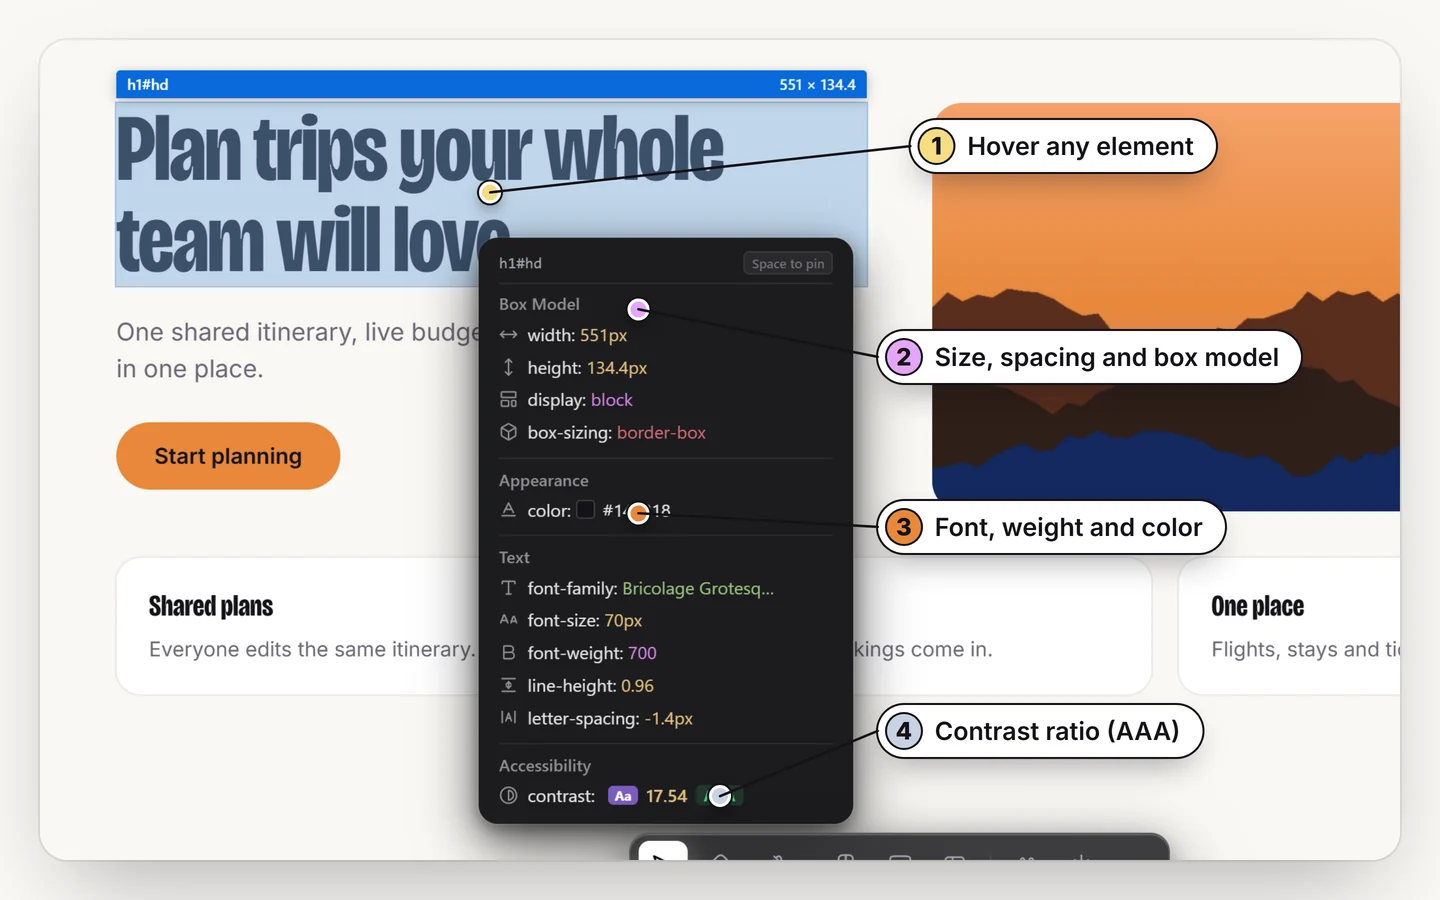
Turn on an inspector extension (in Design Toolkit, Alt + R, then I) and hover the element. A card shows its size, margin, padding, font and colors, and the box model is drawn on the page. Press Space to pin it. No panel to open, no tab to switch.
The usual way: DevTools
Right-click, choose Inspect, find the element in the tree, then read the Styles and Computed tabs. It works, and for debugging it is the right tool. For simply reading a number it costs several clicks and puts a large panel over the thing you are trying to look at.
The faster way: hover and read
1. Turn it on
Press Alt + R, then I for the inspector.
2. Hover the element
A floating card shows the size, margin, padding, font and colors. The box model is drawn on the page itself, in the real positions.
3. Pin or copy
Press Space to pin the card, or use the arrow keys to move to the parent or child element.
DevTools or an inspector? A quick comparison
| You want to | Best choice |
|---|---|
| Read one element's size, spacing, font or color | Hover inspector |
| See the gap between two elements | Hover inspector (measure mode) |
| Debug JavaScript or network calls | DevTools |
| Edit a rule live and see the effect | DevTools |
| Copy resolved CSS, Tailwind or a style object | Hover inspector |
Measuring the space between elements
The number DevTools does not show directly is the distance between two elements. Press M, select one, hover another and read the exact gap in pixels. The full walkthrough is in how to measure the distance between elements.
Pause, quit and hide the toolbar
Three small buttons at the end of the toolbar keep it out of your way. Pause (P) freezes the inspector so you can use the page's own buttons and menus without it reacting; press it again to resume. Quit (Esc) turns Design Toolkit off. Hide dock (H) tucks the toolbar away and leaves a small tab to bring it back.
Inspect without the panel
Hover for the numbers, pin it with Space. Free for 7 days.
Add to ChromeNo accountRuns locally14-day refund
Common questions
How do I inspect an element without opening DevTools?
Use an inspector extension. In Design Toolkit, press Alt + R, then I, and hover the element: its size, margin, padding, font and colors appear in a card on the page.
Can I see the box model without DevTools?
Yes. The inspector draws the box model over the page: margin, border, padding and content, in their real positions.
Does an inspector change the website?
No. Nothing is added to the page until you turn the toolkit on, and pressing P pauses it so you can use the page normally.
Is DevTools still needed?
For debugging scripts, network requests and live-editing rules, yes. An inspector replaces the quick lookups, not the debugging.
How do I use the page normally while the inspector is on?
Press P to pause. The inspector stops reacting to the pointer, so you can click the page's own menus and buttons. Press P again to continue inspecting.